Saturday, June 29, 2013

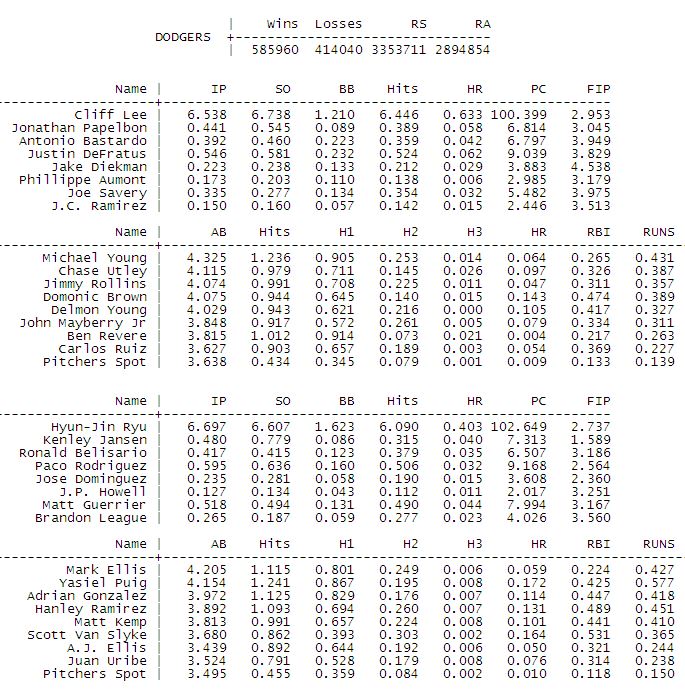
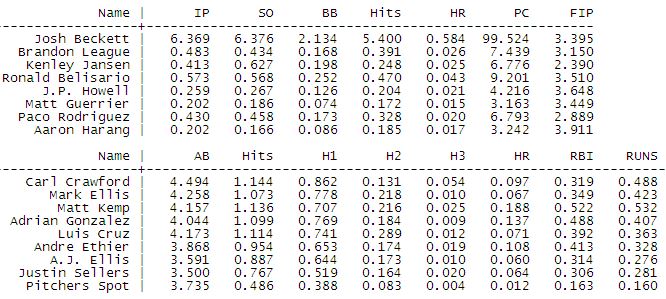
Phillies vs Dodgers - Top 200 Most Likely Final Scores


Note: Out of one million games simulated.

RankPHILANCount RankPHILANCount
11257816 101311817
22351597 102112784
30140798 103510722
43436095 104105718
52135952 10579707
63232823 10697701
71331649 107112693
80230175 108111668
93125278 109113644
100324892 110411625
111024598 111212618
122424485 11298603
131423463 113106558
144322525 114012551
154520932 115610520
164220851 116114504
172020407 117312496
180418529 118110472
194117523 119107435
202516927 120511415
211516446 121115404
223016308 122122404
233514817 123123370
245213601 124910368
250513536 125113364
265313198 126121364
275412780 127412354
285112088 128710354
294011871 129013322
301611136 130213319
315610883 131116297
322610719 132108293
33369783 133611292
34069120 134313286
35628791 135124276
36638454 136810271
37508403 137120260
38617931 138512255
39467763 139125234
40647347 140132229
41177247 141131225
42276923 142109224
43656646 143117218
44076236 144133214
45375767 145114205
46725579 146413205
47605566 147214192
48715240 148711187
49735181 149014174
50675025 150118174
51474801 151134174
52184723 152811169
53284468 153130155
54744368 154126153
55083958 155513149
56573718 156314147
57703678 157612132
58753629 1581011127
59823624 159135124
60383442 160712123
61813287 161119121
62833225 162141115
63763214 163143112
64193032 164115109
65292790 165911107
66482744 166142107
67842695 167215106
68092588 168414106
69802352 169015102
70392281 170127102
71922201 171144102
72782151 172111093
73582144 17361386
74852065 17431585
75912001 17514584
76931967 17651482
772101836 17713681
781101781 17814080
79861747 17981279
80491662 18041572
81681658 18112872
82941582 18211669
830101558 18313769
843101469 18412966
85901452 18561464
86871427 18614664
871021265 18715364
88951222 18871363
89591158 18915158
901011129 19015256
911111118 19191252
921031080 19231651
93961006 19351551
94211992 19421748
95410981 19501647
9689960 196111245
97104919 19713845
98011918 19821644
9969904 199121044
100100837 20015042

Phillies vs Dodgers Simulation Results - June 29th


Wednesday, June 26, 2013

Introducing Win Probability Added Over Expectation OR WPAOE


This conversation over at The Book Blog about why Fangraphs, who posts live Win Expectancy does not take into consideration the actual players who are playing in the game got me thinking. Fangraphs uses a one sized fits all chart for things like Win Expectancy (WE), Win Probability Added (WPA) and Leverage Index (LI). The problem is you are getting the exact same WE for a 0-0 first inning game with the Astros (Dallas Keuchel) facing the Tigers in Detroit with Justin Verlander or Max Scherzer pitching as you would for two evenly pitted teams.  You are also getting incorrect WPA's for each game event.  These discrepancies last throughout the entire game. For those wanting to get a true in game Win Expectancy or Win Probability Added you aren't going to get one all the time.  To others it might not be a big deal as the one size fits all chart is somewhat reasonable.  But it is uninteresting when you can get close to the real thing. Why not shoot for the real thing, when it can be done? Why use two sticks to make fire when you have a lighter?

While I think it should be a goal to do better on the in game Win Expectancies, I can see some usefullness of the WPA as it tells you a story of what players earned what portions of a win or a loss.  I do however find it a little troubling that players are receiving too much or too little their fair share of WPA due to WPA not adjusting for strength/weakness of opponent.  If a game that should be a 75/25 WE game gets calculated as a 50/50 WE game then the stronger team is more likely than not going to be gaining 0.25 points of WPA that they shouldn't be getting.  That is why I am proposing a new variation of WPA, called Win Probability Added Over Expectation (WPAOE) in which a player will exceed expectation if he scores a WPAOE of over 0.0 (and less than 0.0 for not meeting expectation).  WPAOE will use a "more correct" version of Win Expectancy to calculate how much each game event (out, hit, stolen base etc...) changes the contribution each player made to the win or loss.

So how can you calculate the true in game win expectancy?  Well, this isn't something the average person can do.  The pre-game win expectancy can easily be calculated from Vegas odds.  But how do you adjust this in game WE as the game goes on?  You basically need a "good" baseball game simulator.  Something that sites like Fangraphs do not have.  Even if they had one, you would run in to the problem of how quickly could it compute a new in game Win Expectancy after every game event and for multiple games.  So there are some difficult technical hurdles, but I am laying the groundwork for how this could and should eventually be done.

In the example below, I took the 2013 game with the highest pre-game win expectancy and went through and calculated all the win expectancies and WPAOEs after each game event as an example of how I imagine this to look somewhere down the road.  As you see, the game starts out with the Tigers as a 78.23% favorite (SIM WE = Tigers WE), while Fangraphs starts the Tigers WE at 50.0%.  So in a nutshell, what I did here is simulate this game 1 million times at every new game state.  All win expectancies (FG, Sim) are listed with the Tigers percent chance of winning.  And yes, my simulator accounts for pretty much everything meaningful you can think of.

PitcherPlayerInnOutsBaseHOU RunsDET RunsPlayFG WESIM WEFG WPASIM WPA
NANA-00005078.2300
M.ScherzerR.GrossmanT10000BB46.575.930.0350.023
M.ScherzerJ.ElmoreT10100KS49.878.13-0.033-0.022
M.ScherzerR.GrossmanT11100CS53.880.48-0.04-0.0235
M.ScherzerC.PenaT12000F-854.881.26-0.01-0.0078
D.KeuchelO.InfanteB10000KS52.679.72-0.022-0.0154
D.KeuchelT.HunterB11000F-95178.29-0.016-0.0143
D.KeuchelM.CabreraB12000F-95076.97-0.01-0.0132
M.ScherzerC.CarterT20000F-352.478.11-0.024-0.0114
M.ScherzerJ.MartinezT21000F-95478.93-0.016-0.0082
M.ScherzerC.CorporanT21000HR43.168.210.1090.1072
M.ScherzerJ.ParedesT22010KS44.168.68-0.01-0.0047
D.KeuchelP.FielderB200104-341.666.49-0.025-0.0219
D.KeuchelV.MartinezB210106-339.864.81-0.018-0.0168
D.KeuchelJ.PeraltaB22010BB41.266.040.0140.0123
D.KeuchelM.TuiasosopoB221101B44.169.10.0290.0306
D.KeuchelB.PenaB225111B54.579.420.1040.1032
D.KeuchelA.GarciaB22314HR80.395.610.2580.1619
D.KeuchelO.InfanteB220146-379.795.43-0.006-0.0018
M.ScherzerM.DominguezT30014KS81.995.99-0.022-0.0056
M.ScherzerM.GonzalezT310144-383.396.31-0.014-0.0032
M.ScherzerR.GrossmanT32014KC84.296.51-0.009-0.002
D.KeuchelT.HunterB30014F-98396.16-0.012-0.0035
D.KeuchelM.CabreraB310141B84.396.360.0130.002
D.KeuchelP.FielderB311144-6-381.795.48-0.026-0.0088
M.ScherzerJ.ElmoreT400142B7693.780.0570.017
M.ScherzerJ.ElmoreT40214Balk73.693.280.0240.005
M.ScherzerC.PenaT404241B68.889.810.0480.0347
M.ScherzerC.CarterT40124BB61.886.080.070.0373
M.ScherzerJ.MartinezT40354HR37.559.190.2430.2689
M.ScherzerC.CorporanT40054F-739.860.54-0.023-0.0135
M.ScherzerJ.ParedesT410542B35.657.170.0420.0337
M.ScherzerJ.ParedesT41254CS41.561.46-0.059-0.0429
M.ScherzerM.DominguezT42054F-542.662.2-0.011-0.0074
D.KeuchelV.MartinezB40054KS39.659.57-0.03-0.0263
D.KeuchelJ.PeraltaB41054BB42.962.060.0330.0249
D.KeuchelM.TuiasosopoB411541B47.866.370.0490.0431
D.KeuchelB.PenaB413545-4-33655.82-0.118-0.1055
M.ScherzerM.GonzalezT500543-138.457.18-0.024-0.0136
M.ScherzerR.GrossmanT51054F-940.158.28-0.017-0.011
M.ScherzerJ.ElmoreT52054KS41.358.94-0.012-0.0066
D.KeuchelA.GarciaB50054KS37.955.28-0.034-0.0366
D.KeuchelO.InfanteB51054F-835.552.14-0.024-0.0314
D.KeuchelT.HunterB52054F-833.850-0.017-0.0214
M.ScherzerC.PenaT60054KC36.351.51-0.025-0.0151
M.ScherzerC.CarterT61054KS38.152.72-0.018-0.0121
M.ScherzerJ.MartinezT620546-339.453.43-0.013-0.0071
D.KeuchelM.CabreraB60054F-835.452.57-0.04-0.0086
D.KeuchelP.FielderB610544-332.556.18-0.0290.0361
D.KeuchelV.MartinezB62054E-634.753.270.022-0.0291
D.KeuchelJ.PeraltaB621541B38.252.010.035-0.0126
D.KeuchelM.TuiasosopoB623551B56.475.10.1820.2309
T.BlackleyB.PenaB62355F-45069.53-0.064-0.0557
M.ScherzerC.CorporanT70055BB44.165.450.0590.0408
M.ScherzerJ.ParedesT70155FC49.769.18-0.056-0.0373
M.ScherzerM.DominguezT71155F-854.671.75-0.049-0.0257
M.ScherzerJ.ParedesT72155CS58.873.51-0.042-0.0176
T.BlackleyA.GarciaB70055F-554.972.2-0.039-0.0131
E.GonzalezO.InfanteB710551B5974.950.0410.0275
E.GonzalezO.InfanteB71155Pick Off52.169.34-0.069-0.0561
E.GonzalezT.HunterB72055BB54.270.480.0210.0114
E.GonzalezM.CabreraB72155KS5065.44-0.042-0.0504
D.SmylyM.GonzalezT80055KS54.767.57-0.047-0.0213
D.SmylyR.GrossmanT810551B49.865.640.0490.0193
D.SmylyJ.ElmoreT811551B43.159.670.0670.0597
D.SmylyC.PenaT81355KC51.765.57-0.086-0.059
A.AlburquerqueR.GrossmanT82355WP48.864.30.0290.0127
A.AlburquerqueC.CarterT82655KS60.773.25-0.119-0.0895
W.WrightP.FielderB80055KS56.168.95-0.046-0.043
W.WrightV.MartinezB81055F-852.665.31-0.035-0.0364
H.AmbrizJ.PeraltaB82055KS5063.43-0.026-0.0188
A.AlburquerqueJ.MartinezT90055BB41.861.480.0820.0195
P.CokeC.CorporanT901652B11.613.430.3020.4805
P.CokeJ.ParedesT90265SAC 5-311.913.29-0.0030.0014
P.CokeM.DominguezT91475SAC F-98.89.160.0310.0413
P.CokeM.GonzalezT920751-39.211.67-0.004-0.0251
J.VerasD.KellyB900753-14.55.75-0.047-0.0592
J.VerasB.PenaB91075BB10.713.430.0620.0768
J.VerasA.DirksB91175F-64.55.73-0.062-0.077
J.VerasB.PenaB92175DI4.86.020.0030.0029
J.VerasO.InfanteB92275BB9.111.870.0430.0585
J.VerasT.HunterB92375HBP17.527.730.0840.1586
J.VerasM.CabreraB92775F-800-0.175-0.2773

Note: My post over at The Book Blog on this subject.

I’m still not convinced we need to treat each game with a 50/50 starting point for WPA, especially when you have a game where a team is a lopsided 78% favorite to win that game.  Why not give the favored team 22% of positive WPA to play with.  If Kershaw starts the game with the Dodgers having a 78% chance of winning and leaves the game with the Dodgers having a 78% chance of winning then he has “done his job” WPA-wise.  Why should he and the rest of his team get extra added WPA just because they are playing against a bad team and they have a great pitcher starting for them?  This seems worse.

0.0 WPA should be the baseline of expected WPA for each player and giving a team that is a 78% favorite 22% of positive WPA to play with does just that.  If you start them out at 50/50 and don’t take into consideration the likelihood of one team winning over the other then you are padding their positive WPA with an extra of 28% of positive WPA points on average.  This just doesn’t seem right.  So what if the winning team only accumulates 0.22 points of WPA and the losing team accumulates -0.22 points of WPA hen the favorite wins.  You are incorrectly assigning WPA to individual players by assuming every game is a 50/50 game.

If the initial Win Expectancy was correct and everything played out perfectly with the season simulated billions of times you’d expect to see everyone’s WPA converge to zero.  But the season is one sample size (162 games) and WPA is pretty much a “story” stat so what you will see are players who exceeded expecations with a WPA over zero and players who did not exceed expecations with a WPA of under zero and players who met expectations with a WPA of right around zero.

Maybe a new stat?  Win Probability Added Over Expectation (WPAOE) ??

Tangotiger Response:
Everything you are saying is correct.  If Kershaw does his job exactly as intended, such that they had a 78% chance of winning entering the game and 78% chance of winning when he leaves, then he’s accumulated 0.0 wins IN-GAME.

Wednesday, June 19, 2013

MLB World Series Odds - June 19th


Team12/15/12 Odds12/29/12 Odds5/22/20136/20/2013
Tigers7776
Cardinals1414116.5
Braves161697.5
Athletics40302510
Rangers10147.2511
Reds101213.511
Red Sox30301412
Nationals889.516
Orioles50502516
Giants141413.518
Yankees101213.520
Diamdonbacks40503520
Pirates50504020
Blue Jays10103522
Rays20162525
Dodgers772733
Indians60803033
Angels773333
Royals30404033
Phillies16146640
Rockies1001006640
Padres10010015040
White Sox4040175150
Twins100100200150
Mariners6080175200
Mets60100200250
Brewers3030125500
Cubs6050300500
Astros10010025002500
Marlins10010025005000

Thursday, June 13, 2013

Bullpen Win Probability Added Leaders by Team


TeamWPA
Rangers5.62
Pirates5.53
Yankees3.75
Rockies3.71
Athletics3.58
Twins3.50
Blue Jays3.16
Diamondbacks3.06
White Sox2.92
Braves2.51
Padres1.89
Red Sox1.87
Brewers1.41
Angels1.33
Nationals0.63
Cardinals0.39
Marlins0.27
Royals0.20
Giants0.17
Reds0.09
Tigers0.00
Indians-0.52
Orioles-0.80
Phillies-1.78
Rays-2.32
Mariners-2.66
Astros-2.69
Mets-2.91
Dodgers-3.54
Cubs-3.77

Source: Fangraphs


Wednesday, June 05, 2013

Padres vs Dodgers - June 5th Simulation Results


The simulator has the Dodgers as a heavy favorite to win the game tonight. Vegas odds are right in line with the simulation results as Vegas gives the Dodgers right around a 67% chance of winning this game.

Sunday, May 26, 2013

Angels vs Dodgers - Simulation Results May 27th


Time For Matt Kemp To Take A Break?


Coming in to the 2013 Dodgers season, as most Dodgers fans were busy ordering playoff tickets and getting fitted for Championship t-shirts, I was saying to myself that I didn't want to "win this way" and more importantly I didn't want to "lose this way".  Well, here we are only at the end of May but the Dodgers are definitely "losing this way".  Yeah, there are lots of problems, too many for me to cover but the one that really sticks out is Matt Kemp being a shell of his former self at the plate.

2013 Matt Kemp
- wOBA 0.285
- OPS 0.656

Those are awful numbers.  Those are the numbers are number four hitter has been putting up for the first two months of the season.  And apparently Matt Kemp is not in a slump.  He is not unlucky.  He is just not good at hitting for the time being.

What's wrong with Matt Kemp?  Who knows.  I will leave that for the medical staff, hitting coaches and sports psychologists out there.  But what I do know, is that you cannot have your number three hitter putting up an OPS of 0.656 over a two month period with NO sign that a turn around is on the horizon.

Here are some options, and there are likely a few more.  In draconian order.

1. Put Matt Kemp on the DL and send him to the minors to rehab.

Pros: Matt Kemp is "hurting" this team and the team with its payroll is in a win now mode.  Matt Kemp is weighting down this ship.  Call up Joc Pederson who is tearing up AA and let Skip Schumaker back him up.

Cons: Nobody seems to know for sure what is causing Matt Kemp not to hit and nobody seems to know what course of action will help him rebound.  Matt's ego.

2. Bench Matt Kemp

Pros: He can rest a little bit and still see the occasional major league pitcher while working on his swing in the cages with hitting coach Mark McGwire.  He won't be making as many outs.  Joc Pederson or someone from the minors gets a chance.

Cons:  Nobody seems to know for sure what is causing Matt Kemp not to hit and nobody seems to know what course of action will help him rebound.  Matt's ego.

3. Drop Matt Kemp in the batting order.

Pros: Matt Kemp still gets to see major league pitching but perhaps does less damage to the Dodgers offense batting 7th or 8th in the order.

Cons:  Nobody seems to know for sure what is causing Matt Kemp not to hit and nobody seems to know what course of action will help him rebound. Matt's ego.

The biggest problem to me is the fact that nobody seems to know for sure what is Matt Kemp's problem at the plate.  Is it physical or is it mental or somewhere in between.  And if so, what is the right path to take.  This team was built to win NOW.  The payroll is enormous.  The pressure to win is enormous.  This team already has enough dead weight.  We have two very good outfielders in the minor leagues.  There would obviously be some risk in calling them up to play a tough defensive position and Carl Crawford can probably no longer play CF due to his weak throwing arm.  I would start at #3 on my list and every 7-10 days move up a notch.  Moving him down in the lineup will not help him get better but if you are going to play him every day just because he supposedly needs to play to get better/feel better (w/e that means) then for the love of God drop in the batting order.  If no improvement is made (which there likely won't be) then bench him and let him rest and work out the kinks out of the batting order where he cannot hurt this team.  If that doesn't work then send his butt down to the minors to work it out.  I wish him the best, but this team needs to win now and it isn't likely to happen with Matt Kemp playing every day and batting fourth in the lineup.

Wednesday, May 22, 2013

2013 World Series Odds

Team12/15/12 Odds12/29/12 Odds5/22/2013
Tigers777
Rangers10147.25
Braves16169
Nationals889.5
Cardinals141411
Yankees101213.5
Reds101213.5
Giants141413.5
Red Sox303014
Rays201625
Athletics403025
Orioles505025
Dodgers7727
Indians608030
Angels7733
Blue Jays101035
Diamdonbacks405035
Royals304040
Pirates505040
Phillies161466
Rockies10010066
Brewers3030125
Padres100100150
White Sox4040175
Mariners6080175
Mets60100200
Twins100100200
Cubs6050300
Marlins1001002500
Astros1001002500

Note: All odds are "to 1", ie - 60 is 60-1 odds.

Dodgers vs Brewers - Simulation Results May 22nd


Friday, May 17, 2013

Vegas Top Favorites


DateAwayHomeAway SPHome SPVegas FaveML FaveML DogVegas Win ExpResult
5/15/2013HOUDETDan KeuchelMax ScherzerDET-36032577.40%HOU 7-5
5/14/2013HOUDETLucas HarrellDoug FisterDET-28526573.33%DET 6-2
5/13/2013HOUDETBud NorrisAnibal SanchezDET-27525772.68%DET 7-2
4/30/2013HOUNYAPhillip HumberHiroki KurodaNYA-27325672.57%NYA 7-4
4/27/2013HOUBOSBrad PeacockFelix DoubrontBOS-26525072.03%BOS 8-4
5/5/2013DETHOUJustin VerlanderPhillip HumberDET-26024571.63%DET 9-0
4/1/2013MIAWASRicky NolascoStephen StrasburgWAS-25824471.51%WAS 2-0
4/3/2013MIAWASKevin SloweyGio GonzalezWAS-25824471.51%WAS 3-0
4/25/2013HOUBOSPhillip HumberClay BuchlzBOS-25024071.01%BOS 7-2
4/30/2013MINDETVance WorleyJustin VerlanderDET-25024071.01%DET 6-1

Dodgers vs Braves - May 17th Simulation Results


Tuesday, May 07, 2013

Diamondbacks vs Dodgers - May 7th Simulation Results


Environmental Friendly Dodgers Busy Conserving Power


Normally conserving power is a good thing.  We all want cleaner air to breath, right?  Well, the 2013 version of the Los Angeles Dodgers - the same Dodgers that are highly paid if I remember my numbers correctly are doing their part in conserving power.  Their bats have been recycled and sent to wind farms in the Far East.  Their homerun trots have been outsourced to Cleveland and most notably their winning percentage is at a 52 week low.  So what's going on?  Heck if I (or Mark McGwire for that matter) know - but here are the numbers and they will make you feel green.

First let's look at the pathetic

NameHR
Carl Crawford5
Adrian Gonzalez3
Andre Ethier3
A.J. Ellis2
Juan Uribe2
Mark Ellis2
Clayton Kershaw1
Hanley Ramirez1
Jerry Hairston1
Justin Sellers1
Matt Kemp1

Yes, that is right. Matt Kemp only has one HR. Luckily, Carl Crawford has come out of his shell this season to lead the team with five homeruns. Perhaps Crawford shouldn't be hitting in front of the pitcher for the time being, no?

Well, how is the rest of the league doing? 22 homeruns is probably middle of the pack or something, don't you think? Hmmm, not quite.

More Leaderboards

RankTeamHRTeamOBPTeamSLGTeamwOBA
1Indians44Rockies0.352Indians0.476Rockies0.356
2Braves44Tigers0.352Rockies0.471Indians0.352
3Rockies43Red Sox0.347Red Sox0.451Red Sox0.347
4Blue Jays41Athletics0.343Yankees0.433Tigers0.34
5Yankees40Indians0.34Braves0.429Athletics0.332
6Orioles39Dodgers0.333Tigers0.428Yankees0.33
7Cubs39Reds0.33Brewers0.427Braves0.328
8Rays37Rangers0.33Orioles0.425Rangers0.328
9Red Sox36Yankees0.328Rangers0.42Brewers0.324
10Brewers36Braves0.323Athletics0.413Orioles0.323
11Rangers36Royals0.323Cubs0.412Rays0.318
12White Sox36Brewers0.322Diamondbacks0.409Diamondbacks0.313
13Diamondbacks35Orioles0.322Rays0.407Cardinals0.312
14Mariners35Cardinals0.321Angels0.403Angels0.312
15Pirates34Giants0.32Blue Jays0.399Royals0.311
16Athletics33Twins0.32Pirates0.397Giants0.31
17Mets33Rays0.317Mets0.397Reds0.31
18Angels32Angels0.316Astros0.393Pirates0.308
19Tigers31Diamondbacks0.315Giants0.39Dodgers0.308
20Nationals30Padres0.314Royals0.39Mets0.308
21Astros30Mets0.309Cardinals0.39Cubs0.308
22Reds28Mariners0.308Mariners0.387Mariners0.306
23Phillies28Pirates0.307Nationals0.381Blue Jays0.306
24Cardinals27Astros0.305White Sox0.379Astros0.306
25Giants25Cubs0.301Reds0.378Padres0.305
26Padres25Blue Jays0.301Padres0.378Twins0.305
27Dodgers22Phillies0.298Phillies0.377Nationals0.294
28Twins21Nationals0.295Twins0.366Phillies0.294
29Marlins19Marlins0.29Dodgers0.363White Sox0.289
30Royals16White Sox0.283Marlins0.325Marlins0.273

Yeah, that's pretty ugly. 27th out of 30, 14th out of 15 (NL) in homeruns. Thank God for teams like the Marlins. In slugging percentage the Dodgers drop to 29th, once again with the Marlins cushioning the fall. Is there a silver lining you ask? Well, of course there is. Look at the Dodgers on base percentage. They are 6th! Good news, the offense isn't totally pathetic - just the part where we get runners past first base is. Dodgers management needs to put the breaks on this power conservation policy. Puig in a few more bats, oops did I incorrectly spell 'plug'? Silly me. Gas up the batting cages and turn this ship around.


Thursday, April 18, 2013

Dodgers vs Orioles - April 19th Simulation Results


Top 20 Most Likely Final Scores
1. BAL 3-2
2. BAL 4-3
3. BAL 5-4
4. BAL 2-1
5. LAN 4-3
6. LAN 3-2
7. BAL 6-5
8. BAL 4-2
9. LAN 4-2
10. LAN 5-4
11. BAL 3-1
12. LAN 2-1
13. BAL 5-3
14. LAN 5-3
15. LAN 3-1
16. BAL 5-2
17. BAL 4-1
18. LAN 5-2
19. LAN 4-1
20.LAN 6-5


Wednesday, April 17, 2013

Padres vs Dodgers - April 17th Simulation Results


Top 20 Most Likely Final Scores
1. LAN 2-1
2. LAN 3-2
3. LAN 1-0
4. LAN 2-0
5. LAN 3-0
6. LAN 3-1
7. SD 2-1
8. LAN 4-3
9. LAN 4-0
10. LAN 4-1
11. SD 3-2
12. LAN 4-2
13. SD 1-0
14. LAN 5-0
15. LAN 5-1
16. SD 4-3
17. SD 3-1
18. LAN 5-2
19. LAN 6-0
20. SD 2-0

Monday, April 15, 2013

Padres vs Dodgers - April 16th Simulation Results


Top 25 Most Likely Final Scores
1. LAN 3-2
2. LAN 2-1
3. LAN 4-3
4. SD 3-2
5. SD 2-1
6. LAN 3-1
7. LAN 1-0
8. LAN 4-2
9. SD 4-3
10. LAN 5-4
11. LAN 4-1
12. SD 3-1
13. LAN 2-0
14. SD 4-2
15. LAN 3-0
16. LAN 5-2
17. SD 1-0
18. LAN 5-3
19. LAN 5-1
20.LAN 4-0
21. SD 2-0
22. SD 5-4
23. SD 5-3
24. SD 4-1
25. LAN 6-5


Padres vs Dodgers - April 15th Simulation Results


Top 20 Most Likely Final Scores
1. LAN 3-2
2. LAN 2-1
3. LAN 4-3
4. LAN 3-1
5. SD 2-1
6. SD 3-2
7. LAN 1-0
8. LAN 4-2
9. LAN 4-1
10. LAN 2-0
11. LAN 3-0
12. SD 4-3
13. LAN 4-3
14. LAN 4-0
15. LAN 5-1
16. LAN 5-2
17. SD 3-1
18. SD 1-0
19. SD 4-2
20. LAN 5-3

Friday, April 12, 2013

Dodgers vs Diamondbacks - April 12th Simulation Results


Top 20 Most likely Final Scores:
1. ARI 3-2
2. ARI 4-3
3. ARI 5-4
4. ARI 2-1
5. LAN 3-2
6. LAN 4-3
7. ARI 6-5
8. LAN 4-2
9. ARI 4-2
10. LAN 5-4
11. LAN 3-1
12. LAN 2-1
13. LAN 5-3
14. LAN 5-2
15. LAN 4-1
16. ARI 3-1
17. ARI 5-3
18. ARI 7-6
19. ARI 4-1
20. LAN 5-1

Note: There will be no Saturday/Sunday Simulations.


Wednesday, April 10, 2013

Dodgers vs Padres - April 11th Simulation Results


Simulator:
Dodgers Win Expectancy: 55.35%
Dodgers RS: 3.26
Padres RS: 2.60

Vegas
Dodgers Win Expectancy: 60.86%
Total Runs: ~ 6.8

Top 20 Most Likely Final Scores
1. SD 2-1
2. SD 3-2
3. LAN 2-1
4. SD 1-0
5. LAN 3-2
6. LAN 3-1
7. SD 4-3
8. LAN 1-0
9. LAN 2-0
10. LAN 3-0
11. SD 3-1
12. LAN 4-1
13. SD 2-0
14. LAN 4-2
15. LAN 4-3
16. LAN 4-0
17. SD 4-2
18. LAN 5-1
19. SD 5-4
20. LAN 5-2
.
.
100. LAN 9-7


Dodgers vs Padres - April 10th Simulation Results


Once again, another screenshot of today's simulation box score along with the top 20 most likely scores.

Simulator:
Dodgers Win Expectancy: 53.91%
Dodgers RS: 3.43
Padres RS: 2.87

Vegas
Dodgers Win Expectancy: 53.27%
Total Runs: ~ 6.8

Top 20 Most Likely Final Scores
1. SD 2-1
2. SD 3-2
3. LAN 2-1
4. LAN 3-2
5. SD 1-0
6. SD 4-3
7. LAN 3-1
8. LAN 1-0
9. SD 3-1
10. LAN 2-0
11. LAN 4-2
12. LAN 4-3
13. LAN 4-1
14. SD 2-0
15. LAN 3-0
16. SD 4-2
17. SD 5-4
18. LAN 4-0
19. LAN 5-2
20. LAN 5-1
.
.
100. LAN 10-6


(Click image for larger size)


Tuesday, April 09, 2013

Dodgers vs Padres - April 9th Simulation Results


Here are the simulation results for the April 9th game between the Dodgers and the Padres

Dodgers vs Padres
Josh Beckett vs Clayton Richards

Record: 4-2 (0.667)
RS: 17
RA: 10
Pythag Win%: 0.725
Pythag Pace: 117.5 - 44.5
Pythag Record: 4.35 - 1.65
Record As Favorites: 4-2
Record As Underdogs: 0-0

Simulation Results Notes:
Dodgers win expectancy is 49.52%
Dodgers on average score 3.315 runs
Padres on average score 3.104 runs
Total Runs scored on average: 6.419

Starting Pitching Lines:
Josh Beckett - 6.4ip, 6.4so, 2.1bb, 5.4hits, 0.58hrs, 100pitches, 3.395fip
Clayton Richard - 6.4ip, 4.7so, 1.8bb, 6.3hits, 0.58hrs, 98pitches, 3.718fip

Some numbers from the Vegas odds:
Dodgers win expectancy: 57.89%
Over/Under: 6.5 -112o +102u

Top 20 Most Likely Final Scores:
1. Padres 2-1
2. Padres 3-2
3. Dodgers 2-1
4. Padres 4-3
5. Dodgers 3-2
6. Padres 1-0
7. Dodgers 3-1
8. Padres 3-1
9. Dodgers 4-3
10. Dodgers 4-2
11. Dodgers 1-0
12. Padres 4-2
13. Padres 2-0
14. Padres 5-4
15. Dodgers 2-0
16. Dodgers 4-1
17. Padres 4-1
18. Dodgers 3-0
19. Padres 3-0
20. Dodgers 5-2
.
.
99. Dodgers 11-4

Dodgers Box Score (Click Image To Enlarge)


Friday, April 05, 2013

Pirates vs Dodgers - April 6th Simulation Results


Here are the simulation results for the April 6th game between the Pirates and the Dodgers.

Pirates vs Dodgers
A.J. Burnett vs Clayton Kershaw

Record: 2-2 (0.500)
RS: 10
RA: 8
Pythag Win%: 0.601
Pythag Pace: 97.3 - 64.7
Pythag Record: 2.40 - 1.60
Record As Favorites: 2-2
Record As Underdogs: 0-0

Simulation Results Notes:
Dodgers win expectancy is 64.84%
Pirates on average score 2.500 runs
Dodgers on average score 3.542 runs
Total Runs scored on average: 6.042

Starting Pitching Lines:
A.J. Burnett - 6.08ip, 6.3so, 2.0bb, 6.0hits, 0.63hrs, 98pitches, 3.454fip
Clayton Kershaw - 6.7ip, 9.1so, 1.8bb, 5.1hits, 0.46hrs, 105pitches, 2.201fip

Some numbers from the Vegas odds:
Dodgers win expectancy: 69.23%
Over/Under: 6.0 -105o -105u
Notes: Dodgers are the largest Vegas favorite of the day.

Top 20 Most Likely Final Scores:
1. Dodgers 2-1
2. Dodgers 3-2
3. Dodgers 1-0
4. Pirates 2-1
5. Dodgers 4-3
6. Dodgers 3-1
7. Dodgers 2-0
8. Dodgers 3-0
9. Pirates 3-2
10. Dodgers 4-1
11. Dodgers 4-2
12. Pirates 1-0
13. Dodgers 4-0
14. Pirates 3-1
15. Pirates 4-3
16. Dodgers 5-4
17. Pirates 2-0
18. Dodgers 5-1
19. Dodgers 5-2
20. Pirates 4-2
.
.
100. Dodgers 12-0

Pirates vs Dodgers - April 5th Simulation Results


Here are the simulation results for the April 5th game between the Pirates and the Dodgers.

Pirates vs Dodgers
Jonathan Sanchez vs Zack Greinke

Record: 1-2 (0.333)
RS: 7
RA: 8
Pythag Win%: 0.439
Pythag Pace: 71.2 - 90.8
Pythag Record: 1.32 - 1.68
Record As Favorites: 1-2
Record As Underdogs: 0-0

Simulation Results Notes:
Dodgers win expectancy is 67.68%
Pirates on average score 2.728 runs
Dodgers on average score 4.166 runs
Total Runs scored on average: 6.894

Starting Pitching Lines:
Jonathan Sanchez - 5.2ip, 5.2so, 3.3bb, 5.3hits, 0.59hrs, 93pitches, 4.593fip
Zack Greinke - 6.8ip, 8.9so, 1.5bb, 5.4hits, 0.60hrs, 104pitches, 2.381fip

Some numbers from the Vegas odds:
Dodgers win expectancy: 65.81%
Over/Under: 7.0 +100o -110u
Notes: Dodgers are the largest Vegas favorite of the day.

Top 20 Most Likely Final Scores:
1. Dodgers 3-2
2. Dodgers 2-1
3. Dodgers 4-3
4. Dodgers 3-1
5. Dodgers 1-0
6. Pirates 2-1
7. Pirates 3-2
8. Dodgers 4-2
9. Dodgers 4-1
10. Dodgers 2-0
11. Dodgers 3-0
12. Dodgers 5-4
13. Dodgers 4-0
14. Pirates 4-3
15. Dodgers 5-1
16. Dodgers 5-2
17. Pirates 3-1
18. Pirates 1-0
19. Dodgers 5-3
20. Dodgers 5-0
.
.
99. Dodgers 12-3

Wednesday, April 03, 2013

Giants vs Dodgers - Simulation Results April 3


Here are the simulation results for the April 2nd game between the Giants and the Dodgers.

Giants vs Dodgers
Tim Lincecum vs Josh Beckett

Record: 1-1 (0.500)
RS: 4
RA: 3
Pythag Record: 1.28 - 0.72 (0.640)
Record As Favorites: 1-1
Record As Underdogs: 0-0

Simulation Results Notes:
Dodgers win expectancy is 49.44%
Giants on average score 3.572 runs
Dodgers on average score 3.371 runs
Total Runs scored on average: 6.943

Starting Pitching Lines:
Tim Lincecum - 6.0ip, 6.9so, 2.5bb, 5.5hits, 0.55hrs, 99pitches, 3.351fip
Josh Beckett - 6.2ip, 6.2so, 2.0bb, 6.1hits, 0.59hrs, 99pitches, 3.390fip

Some numbers from the Vegas odds:
Dodgers win expectancy: 54.65%
Over/Under: 6.5 -110o +100u

Top 20 Most Likely Final Scores:
1. Dodgers 3-2
2. Dodgers 2-1
3. Dodgers 4-3
4. Giants 3-2
5. Giants 2-1
6. Giants 3-1
7. Giants 4-3
8. Giants 4-2
9. Dodgers 1-0
10. Dodgers 3-1
11. Dodgers 5-4
12. Dodgers 4-2
13. Giants 2-0
14. Giants 4-1
15. Giants 1-0
16. Dodgers 2-0
17. Dodgers 4-1
18. Giants 5-4
19. Giants 5-3
20. Giants 3-0
.
.
100. Dodgers 9-7

Tuesday, April 02, 2013

Giants vs Dodgers - Simulation Results April 2


Here are the simulation results for the April 2nd game between the Giants and the Dodgers.

Giants vs Dodgers
Madison Bumgarner vs Hyun-Jin Ryu

Record: 1-0
RS: 4
RA: 0
Pythag Record: Infinity
Record As Favorites: 1-0
Record As Underdogs: 0-0

Simulation Results Notes:
Dodgers win expectancy is 48.89%
Giants on average score 3.395 runs
Dodgers on average score 3.127 runs
Total Runs scored on average: 6.522

Starting Pitching Lines:
Madison Bumgarner - 6.4ip, 6.8so, 1.6bb, 6.2hits, 0.56hrs, 101pitches, 2.982fip
Hyun-Jin Ryu - 6.2ip, 6.6so, 2.3bb, 5.8hits, 0.50hrs, 100pitches, 3.233fip

Giants players most likely to hit a HR: Buster Posey, Hunter Pence, Pablo Sandoval
Dodgers players most likely to hit a HR: Matt Kemp, Adrian Gonzalez, Andre Ethier

Giants hitters most strikeouts: Brandon Belt (1.4 times), Gregor Blanco (1.2), Hunter Pence (1.1)
Dodgers hitters most strikeouts: Carl Crawford (1.2 times), Matt Kemp (1.2), Andre Ethier (1.2)

Giants hitter most walks: Buster Posey (0.51 times)
Dodgers hitter most walks: AJ Ellis (0.48 times)

Some numbers from the Vegas odds:
Dodgers win expectancy: 50.37%
Over/Under: 6.5 -120o +110u (or about 6.7 runs)

Top 20 Most Likely Final Scores:
1. Dodgers 2-1
2. Dodgers 3-2
3. Giants 2-1
4. Giants 3-2
5. Dodgers 4-3
6. Dodgers 1-0
7. Giants 3-1
8. Giants 4-3
9. Dodgers 3-1
10. Giants 1-0
11. Giants 4-2
12. Giants 2-0
13. Dodgers 4-2
14. Dodgers 2-0
15. Dodgers 5-4
16. Giants 4-1
17. Giants 3-0
18. Dodgers 4-1
19. Dodgers 3-0
20. Giants 5-2
.
.
100. Dodgers 10-0

Sunday, March 31, 2013

Giants vs Dodgers, Opening Day Simulation Results


Here are the simulation results for the opening day game between the Giants and the Dodgers.

Giants vs Dodgers
Matt Cain vs Clayton Kershaw

Simulation Results Notes:
Dodgers win expectancy is 56.17%
Giants on average score 2.87 runs
Dodgers on average score 3.22 runs
Total Runs scored on average: 6.09

Starting Pitching Lines:
Matt Cain - 6.4ip, 6.2so, 1.7bb, 6.3hits, 0.5hrs, 100pitches, 3.101fip
Clayton Kershaw - 6.6ip, 8.2so, 1.9bb, 5.5hits, 0.4hrs, 104pitches, 2.383fip

Giants player most likely to hit a HR: Buster Posey
Dodgers player most likely to hit a HR: Matt Kemp

Giants hitter most strikeouts: Brandon Belt (1.6 times)
Dodgers hitter most strikeouts: Matt Kemp (1.2 times)

Giants hitter most walks: Buster Posey (0.433 times)
Dodgers hitter most walks: AJ Ellis (0.447 times)

Some numbers from the Vegas odds:
Dodgers win expectancy: 59.76%
Over/Under: 6 -115o +105u

Top 20 Most Likely Final Scores:
1. Dodgers 2-1
2. Dodgers 3-2
3. Dodgers 1-0
4. Giants 2-1
5. Giants 3-2
6. Dodgers 4-3
7. Dodgers 3-1
8. Dodgers 2-0
9. Giants 1-0
10. Giants 3-1
11. Dodgers 3-0
12. Giants 4-3
13. Dodgers 4-2
14. Giants 2-0
15. Dodgers 4-1
16. Giants 4-2
17. Dodgers 5-4
18. Dodgers 4-0
19. Giants 4-1
20. Giants 3-0
.
.
100. Dodgers 9-8


MLB Simulation Results - March 31st


Away
Home
Favorite
Vegas ML
Vegas Win Exp
Vegas Total Runs
Sim Win Exp
Sim Total Runs
Texas
Houston
Texas
-160 / +150
60.78%
8.5 o100, u-120
59.66%
7.75


Most Likely Final Scores


1 HOU 3-2 6:1
 
51 TEX 7-6 37:1
2 TEX 3-2 7:1
 
52 TEX 8-4 37:1
3 HOU 2-1 7:1
 
53 TEX 9-2 40:1
4 HOU 4-3 7:1
 
54 TEX 9-3 43:1
5 TEX 2-1 8:1
 
55 HOU 5-0 44:1
6 TEX 4-3 8:1
 
56 HOU 7-4 44:1
7 TEX 4-2 9:1
 
57 HOU 7-3 47:1
8 TEX 3-1 9:1
 
58 TEX 9-1 47:1
9 HOU 5-4 11:1
 
59 TEX 8-5 47:1
10 TEX 4-1 11:1
 
60 HOU 7-5 47:1
11 TEX 5-3 12:1
 
61 HOU 7-2 49:1
12 TEX 5-2 12:1
 
62 TEX 8-0 50:1
13 TEX 5-4 12:1
 
63 TEX 9-4 56:1
14 HOU 3-1 12:1
 
64 TEX 8-6 59:1
15 HOU 4-2 13:1
 
65 HOU 7-1 59:1
16 TEX 2-0 14:1
 
66 HOU 6-0 63:1
17 TEX 5-1 14:1
 
67 TEX 10-2 63:1
18 HOU 1-0 15:1
 
68 TEX 10-3 66:1
19 TEX 1-0 15:1
 
69 HOU 8-7 66:1
20 TEX 3-0 16:1
 
70 TEX 10-1 68:1
21 TEX 6-3 16:1
 
71 TEX 9-0 68:1
22 TEX 6-2 16:1
 
72 TEX 9-5 74:1
23 HOU 5-3 16:1
 
73 HOU 8-2 76:1
24 HOU 4-1 17:1
 
74 TEX 8-7 76:1
25 TEX 6-4 18:1
 
75 HOU 8-3 77:1
26 TEX 6-1 18:1
 
76 HOU 8-4 79:1
27 HOU 6-5 18:1
 
77 HOU 8-5 82:1
28 TEX 4-0 18:1
 
78 TEX 10-4 85:1
29 HOU 5-2 19:1
 
79 TEX 11-2 89:1
30 HOU 2-0 19:1
 
80 TEX 9-6 94:1
31 TEX 6-5 20:1
 
81 HOU 8-6 94:1
32 TEX 5-0 22:1
 
82 HOU 8-1 97:1
33 TEX 7-2 22:1
 
83 HOU 7-0 98:1
34 HOU 3-0 22:1
 
84 TEX 10-0 99:1
35 TEX 7-3 23:1
 
85 TEX 10-5 100:1
36 TEX 7-1 24:1
 
86 TEX 11-1 104:1
37 TEX 7-4 25:1
 
87 TEX 11-3 106:1
38 HOU 5-1 26:1
 
88 TEX 11-4 120:1
39 HOU 6-4 26:1
 
89 HOU 9-3 120:1
40 TEX 6-0 26:1
 
90 HOU 9-2 124:1
41 HOU 6-3 27:1
 
91 TEX 9-7 128:1
42 TEX 8-2 30:1
 
92 HOU 9-4 132:1
43 HOU 6-2 31:1
 
93 TEX 11-0 135:1
44 TEX 7-5 31:1
 
94 TEX 12-2 135:1
45 HOU 4-0 31:1
 
95 TEX 10-6 144:1
46 TEX 8-3 33:1
 
96 TEX 12-3 145:1
47 TEX 8-1 33:1
 
97 HOU 9-8 145:1
48 HOU 7-6 34:1
 
98 HOU 8-0 152:1
49 TEX 7-0 35:1
 
99 HOU 9-1 156:1
50 HOU 6-1 37:1
 
100 TEX 12-1 159:1

Monday, March 25, 2013

Dodgers Best Lineup


With Hanley Ramirez starting the season on the DL, the Dodgers will have to make some changes to their starting lineup and with these changes comes the question of what their most productive lineup is.  I used my simulator to figure out just that.  I used 2013 Bill James projections as input and for this exercise I had the simulator come up with the most productive lineup against RHP.  I assumed that the Dodgers would start Nick Punto at 3B against RHP and I am not about to project Puig as a starter yet.  Here is the best lineup that it found.

1. Carl Crawford  (L)
2. Matt Kemp
3. Adrian Gonzalez  (L)
4. Andre Ethier  (L)
5. Luiz Cruz
6. Mark Ellis
7. Nick Punto  (S)
8. A.J. Ellis
9. Pitchers Spot

I was surprised to see that batting the pitcher 8th was no longer the best option.  I suppose having a weak hitter like Nick Punto in the lineup put a damper on that strategy.

Wednesday, February 20, 2013

Exportable 2013 MLB Schedule


Something that is difficult to find on the internet is an excel download file of the 2013 MLB Schedule.  I have taken the time to type up the complete 2013 MLB Schedule in to CSV format and uploaded it to google docs.  The file is free to download and can be found at the following link.

Here is the format that the file is in

Game ID,Year,Month,Day,Away,Home

1,2013,3,31,TEX,HOU
2,2013,4,1,FLA,WAS
3,2013,4,1,SD,NYN
4,2013,4,1,CHN,PIT
5,2013,4,1,COL,MIL
6,2013,4,1,SF,LAN
7,2013,4,1,PHI,ATL
8,2013,4,1,STL,ARI
9,2013,4,1,DET,MIN
10,2013,4,1,BOS,NYA
.
.
.
2428,2013,9,29,OAK,SEA
2429,2013,9,29,COL,LAN
2430,2013,9,29,WAS,ARI

Tuesday, February 12, 2013

2013 MLB Win Totals - Part I


Instead of just posting the current Vegas MLB odds to win the World Series, I am going to take things a step further and interpolate those W.S. odds out to 2013 win totals. There is no great scientific method that I am going to be using except for keeping consistent with the Vegas odds in the order I assign team wins.  I think I have a pretty good idea at what Vegas typically sets their highest and lowest over/under win totals at, so everything in between I can do an "eye ball" interpolation on to set the win total over/under for each team. Later in my Part II of this series, I will use a more scientific method for matching up the Vegas odds to win totals. But for now... here we go!

TeamOdds To Win W.S.% Chance to Win2013 Wins Over/Under
Angels8-18.3993
Dodgers8-18.3993
Blue Jays8-18.3993
Nationals8-18.3993
Tigers9-17.5592
Braves12-15.8190
Yankees12.5-15.5989
Reds13-15.4088
Rangers13.5-15.2188
Phillies17-14.2086
Giants17-14.2086
Red Sox20-13.6085
Cardinals20-13.6085
Rays22-13.2884
Athletics30-12.4482
Orioles40-11.8481
Diamondbacks45-11.6480
White Sox50-11.4879
Royals50-11.4879
Brewers50-11.4879
Pirates72-11.0377
Mets75-10.9975
Padres75-10.9975
Indians77.5-10.9675
Cubs100-10.7571
Rockies100-10.7571
Mariners110-10.6870
Twins125-10.6067
Marlins150-10.5063
Astros200-10.3861

Notes: 
Percent chance of winning W.S. has the Vegas juice removed.
American League has a 51.5% (Vegas) chance of winning the W.S.
National League has a 48.5% (Vegas) chance of winning the W.S.
Odds were taken from 5Dimes on 2/12/13.
In calculating the pecent chance to win the W.S., I removed the Vegas "juice".
The 2013 Over/Unders from the Atlantis came out the day after this post.

For the most part, I did a straight interpolation from (Vegas) World Series odds to an over/under on team wins.  There a couple of things that could be wrong with this.  The first comes from the possibility that the Vegas World Series odds have some bias to them.  Perhaps Vegas moved the odds up or down based on how popular a team is.  This of course has nothing to do with my methodology.  On the otherhand, something that does have to do with my methodology is that I am not controlling for the teams playing in divisions.  Divisions that may be stronger or weaker than others.  For example, the Royals might win a World Series out of every 50 times playing out of the AL Central, but what if they played out of the AL East?  Chances are that 50 number would climb.  A next step to this exercise would be to control for how hard or easy it is to win a division.  I'm not sure on the best way to do this yet, so if you have any ideas feel free to leave a comment or send me a tweet (@DodgerSims).

Wednesday, January 30, 2013

2013 World Series Odds


As of 1/30/2013...

Team12/15/12 Odds12/29/12 Odds1/30/13
Angels7-17-17-1
Tigers7-17-17-1
Dodgers7-17-17-1
Nationals8-18-18-1
Blue Jays10-110-110-1
Yankees10-112-114-1
Reds10-112-112-1
Rangers10-114-118-1
Cardinals14-114-114-1
Giants14-114-114-1
Phillies16-114-114-1
Braves16-116-114-1
Rays20-116-116-1
Brewers30-130-160-1
Red Sox30-130-130-1
Athletics40-130-130-1
Royals30-140-140-1
White Sox40-140-140-1
Diamdonbacks40-150-150-1
Orioles50-150-150-1
Pirates50-150-150-1
Cubs60-150-150-1
Mariners100-180-180-1
Indians100-180-180-1
Mets60-1100-1100-1
Padres100-1100-1100-1
Marlins100-1100-1100-1
Twins100-1100-1100-1
Astros100-1100-1100-1
Rockies100-1100-1100-1

Source: Sportsbook.com

Friday, January 04, 2013

The Better Offense - Rockies or Dodgers


So there is this Buster Olney guy who gets paid money to write about baseball.  Recently, he put up an article where he ranked the best offenses in baseball.  More than a few Dodgers fans were up in arms when Buster ranked the Rockies offense a few spots ahead of the Dodgers offense.  I was asked by a couple followers on twitter to run the numbers through my simulator where I can take into effect things like the enormously friendly park that the Rockies hit in.

This is a pretty easy exercise for me to run in my simulator.  What I did is get park neutral offensive stats for both the Rockies and Dodgers lineups.  I took the 8 starting hitters for each teams, as listed at MLBdepthCharts website and gave each team what the simulator thought was its most efficient lineup.  I then gave each team the exact same starting pitcher, bullpen, bench and made all park factors league average.  I then ran five million individual game simulations, pitting the two teams together.  I let each team be the away/home team and repeated the above process for both a right handed and left handed starting pitcher.

So the only difference is the two hitting lineups, everything else is held constant.  The metric to determine the better offense can now be measured in how many of the five million games each team won.  Here are the results...