
Saturday, April 20, 2013

Thursday, April 18, 2013
Dodgers vs Orioles - April 19th Simulation Results

Top 20 Most Likely Final Scores
1. BAL 3-2
2. BAL 4-3
3. BAL 5-4
4. BAL 2-1
5. LAN 4-3
6. LAN 3-2
7. BAL 6-5
8. BAL 4-2
9. LAN 4-2
10. LAN 5-4
11. BAL 3-1
12. LAN 2-1
13. BAL 5-3
14. LAN 5-3
15. LAN 3-1
16. BAL 5-2
17. BAL 4-1
18. LAN 5-2
19. LAN 4-1
20.LAN 6-5
Wednesday, April 17, 2013
Padres vs Dodgers - April 17th Simulation Results

Top 20 Most Likely Final Scores
1. LAN 2-1
2. LAN 3-2
3. LAN 1-0
4. LAN 2-0
5. LAN 3-0
6. LAN 3-1
7. SD 2-1
8. LAN 4-3
9. LAN 4-0
10. LAN 4-1
11. SD 3-2
12. LAN 4-2
13. SD 1-0
14. LAN 5-0
15. LAN 5-1
16. SD 4-3
17. SD 3-1
18. LAN 5-2
19. LAN 6-0
20. SD 2-0
Monday, April 15, 2013
Padres vs Dodgers - April 16th Simulation Results

Top 25 Most Likely Final Scores
1. LAN 3-2
2. LAN 2-1
3. LAN 4-3
4. SD 3-2
5. SD 2-1
6. LAN 3-1
7. LAN 1-0
8. LAN 4-2
9. SD 4-3
10. LAN 5-4
11. LAN 4-1
12. SD 3-1
13. LAN 2-0
14. SD 4-2
15. LAN 3-0
16. LAN 5-2
17. SD 1-0
18. LAN 5-3
19. LAN 5-1
20.LAN 4-0
21. SD 2-0
22. SD 5-4
23. SD 5-3
24. SD 4-1
25. LAN 6-5
Padres vs Dodgers - April 15th Simulation Results

Top 20 Most Likely Final Scores
1. LAN 3-2
2. LAN 2-1
3. LAN 4-3
4. LAN 3-1
5. SD 2-1
6. SD 3-2
7. LAN 1-0
8. LAN 4-2
9. LAN 4-1
10. LAN 2-0
11. LAN 3-0
12. SD 4-3
13. LAN 4-3
14. LAN 4-0
15. LAN 5-1
16. LAN 5-2
17. SD 3-1
18. SD 1-0
19. SD 4-2
20. LAN 5-3
Friday, April 12, 2013
Dodgers vs Diamondbacks - April 12th Simulation Results

Top 20 Most likely Final Scores:
1. ARI 3-2
2. ARI 4-3
3. ARI 5-4
4. ARI 2-1
5. LAN 3-2
6. LAN 4-3
7. ARI 6-5
8. LAN 4-2
9. ARI 4-2
10. LAN 5-4
11. LAN 3-1
12. LAN 2-1
13. LAN 5-3
14. LAN 5-2
15. LAN 4-1
16. ARI 3-1
17. ARI 5-3
18. ARI 7-6
19. ARI 4-1
20. LAN 5-1
Note: There will be no Saturday/Sunday Simulations.
1. ARI 3-2
2. ARI 4-3
3. ARI 5-4
4. ARI 2-1
5. LAN 3-2
6. LAN 4-3
7. ARI 6-5
8. LAN 4-2
9. ARI 4-2
10. LAN 5-4
11. LAN 3-1
12. LAN 2-1
13. LAN 5-3
14. LAN 5-2
15. LAN 4-1
16. ARI 3-1
17. ARI 5-3
18. ARI 7-6
19. ARI 4-1
20. LAN 5-1
Note: There will be no Saturday/Sunday Simulations.
Wednesday, April 10, 2013
Dodgers vs Padres - April 11th Simulation Results
Simulator:
Dodgers Win Expectancy: 55.35%
Dodgers RS: 3.26
Padres RS: 2.60
Vegas
Dodgers Win Expectancy: 60.86%
Total Runs: ~ 6.8
Top 20 Most Likely Final Scores
1. SD 2-1
2. SD 3-2
3. LAN 2-1
4. SD 1-0
5. LAN 3-2
6. LAN 3-1
7. SD 4-3
8. LAN 1-0
9. LAN 2-0
10. LAN 3-0
11. SD 3-1
12. LAN 4-1
13. SD 2-0
14. LAN 4-2
15. LAN 4-3
16. LAN 4-0
17. SD 4-2
18. LAN 5-1
19. SD 5-4
20. LAN 5-2
.
.
100. LAN 9-7

Dodgers vs Padres - April 10th Simulation Results
Once again, another screenshot of today's simulation box score along with the top 20 most likely scores.
Simulator:
Dodgers Win Expectancy: 53.91%
Dodgers RS: 3.43
Padres RS: 2.87
Vegas
Dodgers Win Expectancy: 53.27%
Total Runs: ~ 6.8
Top 20 Most Likely Final Scores
1. SD 2-1
2. SD 3-2
3. LAN 2-1
4. LAN 3-2
5. SD 1-0
6. SD 4-3
7. LAN 3-1
8. LAN 1-0
9. SD 3-1
10. LAN 2-0
11. LAN 4-2
12. LAN 4-3
13. LAN 4-1
14. SD 2-0
15. LAN 3-0
16. SD 4-2
17. SD 5-4
18. LAN 4-0
19. LAN 5-2
20. LAN 5-1
.
.
100. LAN 10-6
(Click image for larger size)

Tuesday, April 09, 2013
Dodgers vs Padres - April 9th Simulation Results
Here are the simulation results for the April 9th game between the Dodgers and the Padres
Dodgers vs Padres
Josh Beckett vs Clayton Richards
Record: 4-2 (0.667)
RS: 17
RA: 10
Pythag Win%: 0.725
Pythag Pace: 117.5 - 44.5
Pythag Record: 4.35 - 1.65
Record As Favorites: 4-2
Record As Underdogs: 0-0
Simulation Results Notes:
Dodgers win expectancy is 49.52%
Dodgers on average score 3.315 runs
Padres on average score 3.104 runs
Total Runs scored on average: 6.419
Starting Pitching Lines:
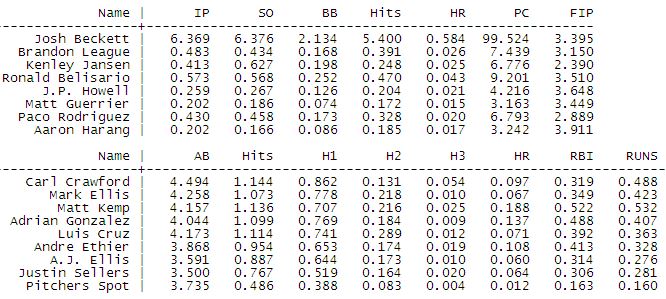
Josh Beckett - 6.4ip, 6.4so, 2.1bb, 5.4hits, 0.58hrs, 100pitches, 3.395fip
Clayton Richard - 6.4ip, 4.7so, 1.8bb, 6.3hits, 0.58hrs, 98pitches, 3.718fip
Some numbers from the Vegas odds:
Dodgers win expectancy: 57.89%
Over/Under: 6.5 -112o +102u
Top 20 Most Likely Final Scores:
1. Padres 2-1
2. Padres 3-2
3. Dodgers 2-1
4. Padres 4-3
5. Dodgers 3-2
6. Padres 1-0
7. Dodgers 3-1
8. Padres 3-1
9. Dodgers 4-3
10. Dodgers 4-2
11. Dodgers 1-0
12. Padres 4-2
13. Padres 2-0
14. Padres 5-4
15. Dodgers 2-0
16. Dodgers 4-1
17. Padres 4-1
18. Dodgers 3-0
19. Padres 3-0
20. Dodgers 5-2
.
.
99. Dodgers 11-4
Dodgers Box Score (Click Image To Enlarge)
Friday, April 05, 2013
Pirates vs Dodgers - April 6th Simulation Results
Here are the simulation results for the April 6th game between the Pirates and the Dodgers.
Pirates vs Dodgers
A.J. Burnett vs Clayton Kershaw
Record: 2-2 (0.500)
RS: 10
RA: 8
Pythag Win%: 0.601
Pythag Pace: 97.3 - 64.7
Pythag Record: 2.40 - 1.60
Record As Favorites: 2-2
Record As Underdogs: 0-0
Simulation Results Notes:
Dodgers win expectancy is 64.84%
Pirates on average score 2.500 runs
Dodgers on average score 3.542 runs
Total Runs scored on average: 6.042
Starting Pitching Lines:
A.J. Burnett - 6.08ip, 6.3so, 2.0bb, 6.0hits, 0.63hrs, 98pitches, 3.454fip
Clayton Kershaw - 6.7ip, 9.1so, 1.8bb, 5.1hits, 0.46hrs, 105pitches, 2.201fip
Some numbers from the Vegas odds:
Dodgers win expectancy: 69.23%
Over/Under: 6.0 -105o -105u
Notes: Dodgers are the largest Vegas favorite of the day.
Top 20 Most Likely Final Scores:
1. Dodgers 2-1
2. Dodgers 3-2
3. Dodgers 1-0
4. Pirates 2-1
5. Dodgers 4-3
6. Dodgers 3-1
7. Dodgers 2-0
8. Dodgers 3-0
9. Pirates 3-2
10. Dodgers 4-1
11. Dodgers 4-2
12. Pirates 1-0
13. Dodgers 4-0
14. Pirates 3-1
15. Pirates 4-3
16. Dodgers 5-4
17. Pirates 2-0
18. Dodgers 5-1
19. Dodgers 5-2
20. Pirates 4-2
.
.
100. Dodgers 12-0
Pirates vs Dodgers - April 5th Simulation Results
Here are the simulation results for the April 5th game between the Pirates and the Dodgers.
Pirates vs Dodgers
Jonathan Sanchez vs Zack Greinke
Record: 1-2 (0.333)
RS: 7
RA: 8
Pythag Win%: 0.439
Pythag Pace: 71.2 - 90.8
Pythag Record: 1.32 - 1.68
Record As Favorites: 1-2
Record As Underdogs: 0-0
Simulation Results Notes:
Dodgers win expectancy is 67.68%
Pirates on average score 2.728 runs
Dodgers on average score 4.166 runs
Total Runs scored on average: 6.894
Starting Pitching Lines:
Jonathan Sanchez - 5.2ip, 5.2so, 3.3bb, 5.3hits, 0.59hrs, 93pitches, 4.593fip
Zack Greinke - 6.8ip, 8.9so, 1.5bb, 5.4hits, 0.60hrs, 104pitches, 2.381fip
Some numbers from the Vegas odds:
Dodgers win expectancy: 65.81%
Over/Under: 7.0 +100o -110u
Notes: Dodgers are the largest Vegas favorite of the day.
Top 20 Most Likely Final Scores:
1. Dodgers 3-2
2. Dodgers 2-1
3. Dodgers 4-3
4. Dodgers 3-1
5. Dodgers 1-0
6. Pirates 2-1
7. Pirates 3-2
8. Dodgers 4-2
9. Dodgers 4-1
10. Dodgers 2-0
11. Dodgers 3-0
12. Dodgers 5-4
13. Dodgers 4-0
14. Pirates 4-3
15. Dodgers 5-1
16. Dodgers 5-2
17. Pirates 3-1
18. Pirates 1-0
19. Dodgers 5-3
20. Dodgers 5-0
.
.
99. Dodgers 12-3
Wednesday, April 03, 2013
Giants vs Dodgers - Simulation Results April 3
Here are the simulation results for the April 2nd game between the Giants and the Dodgers.
Giants vs Dodgers
Tim Lincecum vs Josh Beckett
Record: 1-1 (0.500)
RS: 4
RA: 3
Pythag Record: 1.28 - 0.72 (0.640)
Record As Favorites: 1-1
Record As Underdogs: 0-0
Simulation Results Notes:
Dodgers win expectancy is 49.44%
Giants on average score 3.572 runs
Dodgers on average score 3.371 runs
Total Runs scored on average: 6.943
Starting Pitching Lines:
Tim Lincecum - 6.0ip, 6.9so, 2.5bb, 5.5hits, 0.55hrs, 99pitches, 3.351fip
Josh Beckett - 6.2ip, 6.2so, 2.0bb, 6.1hits, 0.59hrs, 99pitches, 3.390fip
Some numbers from the Vegas odds:
Dodgers win expectancy: 54.65%
Over/Under: 6.5 -110o +100u
Top 20 Most Likely Final Scores:
1. Dodgers 3-2
2. Dodgers 2-1
3. Dodgers 4-3
4. Giants 3-2
5. Giants 2-1
6. Giants 3-1
7. Giants 4-3
8. Giants 4-2
9. Dodgers 1-0
10. Dodgers 3-1
11. Dodgers 5-4
12. Dodgers 4-2
13. Giants 2-0
14. Giants 4-1
15. Giants 1-0
16. Dodgers 2-0
17. Dodgers 4-1
18. Giants 5-4
19. Giants 5-3
20. Giants 3-0
.
.
100. Dodgers 9-7
Tuesday, April 02, 2013
Giants vs Dodgers - Simulation Results April 2
Here are the simulation results for the April 2nd game between the Giants and the Dodgers.
Giants vs Dodgers
Madison Bumgarner vs Hyun-Jin Ryu
Record: 1-0
RS: 4
RA: 0
Pythag Record: Infinity
Record As Favorites: 1-0
Record As Underdogs: 0-0
Simulation Results Notes:
Dodgers win expectancy is 48.89%
Giants on average score 3.395 runs
Dodgers on average score 3.127 runs
Total Runs scored on average: 6.522
Starting Pitching Lines:
Madison Bumgarner - 6.4ip, 6.8so, 1.6bb, 6.2hits, 0.56hrs, 101pitches, 2.982fip
Hyun-Jin Ryu - 6.2ip, 6.6so, 2.3bb, 5.8hits, 0.50hrs, 100pitches, 3.233fip
Giants players most likely to hit a HR: Buster Posey, Hunter Pence, Pablo Sandoval
Dodgers players most likely to hit a HR: Matt Kemp, Adrian Gonzalez, Andre Ethier
Giants hitters most strikeouts: Brandon Belt (1.4 times), Gregor Blanco (1.2), Hunter Pence (1.1)
Dodgers hitters most strikeouts: Carl Crawford (1.2 times), Matt Kemp (1.2), Andre Ethier (1.2)
Giants hitter most walks: Buster Posey (0.51 times)
Dodgers hitter most walks: AJ Ellis (0.48 times)
Some numbers from the Vegas odds:
Dodgers win expectancy: 50.37%
Over/Under: 6.5 -120o +110u (or about 6.7 runs)
Top 20 Most Likely Final Scores:
1. Dodgers 2-1
2. Dodgers 3-2
3. Giants 2-1
4. Giants 3-2
5. Dodgers 4-3
6. Dodgers 1-0
7. Giants 3-1
8. Giants 4-3
9. Dodgers 3-1
10. Giants 1-0
11. Giants 4-2
12. Giants 2-0
13. Dodgers 4-2
14. Dodgers 2-0
15. Dodgers 5-4
16. Giants 4-1
17. Giants 3-0
18. Dodgers 4-1
19. Dodgers 3-0
20. Giants 5-2
.
.
100. Dodgers 10-0
Sunday, March 31, 2013
Giants vs Dodgers, Opening Day Simulation Results
Here are the simulation results for the opening day game between the Giants and the Dodgers.
Giants vs Dodgers
Matt Cain vs Clayton Kershaw
Simulation Results Notes:
Dodgers win expectancy is 56.17%
Giants on average score 2.87 runs
Dodgers on average score 3.22 runs
Total Runs scored on average: 6.09
Starting Pitching Lines:
Matt Cain - 6.4ip, 6.2so, 1.7bb, 6.3hits, 0.5hrs, 100pitches, 3.101fip
Clayton Kershaw - 6.6ip, 8.2so, 1.9bb, 5.5hits, 0.4hrs, 104pitches, 2.383fip
Giants player most likely to hit a HR: Buster Posey
Dodgers player most likely to hit a HR: Matt Kemp
Giants hitter most strikeouts: Brandon Belt (1.6 times)
Dodgers hitter most strikeouts: Matt Kemp (1.2 times)
Giants hitter most walks: Buster Posey (0.433 times)
Dodgers hitter most walks: AJ Ellis (0.447 times)
Some numbers from the Vegas odds:
Dodgers win expectancy: 59.76%
Over/Under: 6 -115o +105u
Top 20 Most Likely Final Scores:
1. Dodgers 2-1
2. Dodgers 3-2
3. Dodgers 1-0
4. Giants 2-1
5. Giants 3-2
6. Dodgers 4-3
7. Dodgers 3-1
8. Dodgers 2-0
9. Giants 1-0
10. Giants 3-1
11. Dodgers 3-0
12. Giants 4-3
13. Dodgers 4-2
14. Giants 2-0
15. Dodgers 4-1
16. Giants 4-2
17. Dodgers 5-4
18. Dodgers 4-0
19. Giants 4-1
20. Giants 3-0
.
.
100. Dodgers 9-8
MLB Simulation Results - March 31st
| Away | Home | Favorite | Vegas ML | Vegas Win Exp | Vegas Total Runs | Sim Win Exp | Sim Total Runs |
| Texas | Houston | Texas | -160 / +150 | 60.78% | 8.5 o100, u-120 | 59.66% | 7.75 |
Most Likely Final Scores
| 1 HOU 3-2 6:1 | | 51 TEX 7-6 37:1 |
| 2 TEX 3-2 7:1 | | 52 TEX 8-4 37:1 |
| 3 HOU 2-1 7:1 | | 53 TEX 9-2 40:1 |
| 4 HOU 4-3 7:1 | | 54 TEX 9-3 43:1 |
| 5 TEX 2-1 8:1 | | 55 HOU 5-0 44:1 |
| 6 TEX 4-3 8:1 | | 56 HOU 7-4 44:1 |
| 7 TEX 4-2 9:1 | | 57 HOU 7-3 47:1 |
| 8 TEX 3-1 9:1 | | 58 TEX 9-1 47:1 |
| 9 HOU 5-4 11:1 | | 59 TEX 8-5 47:1 |
| 10 TEX 4-1 11:1 | | 60 HOU 7-5 47:1 |
| 11 TEX 5-3 12:1 | | 61 HOU 7-2 49:1 |
| 12 TEX 5-2 12:1 | | 62 TEX 8-0 50:1 |
| 13 TEX 5-4 12:1 | | 63 TEX 9-4 56:1 |
| 14 HOU 3-1 12:1 | | 64 TEX 8-6 59:1 |
| 15 HOU 4-2 13:1 | | 65 HOU 7-1 59:1 |
| 16 TEX 2-0 14:1 | | 66 HOU 6-0 63:1 |
| 17 TEX 5-1 14:1 | | 67 TEX 10-2 63:1 |
| 18 HOU 1-0 15:1 | | 68 TEX 10-3 66:1 |
| 19 TEX 1-0 15:1 | | 69 HOU 8-7 66:1 |
| 20 TEX 3-0 16:1 | | 70 TEX 10-1 68:1 |
| 21 TEX 6-3 16:1 | | 71 TEX 9-0 68:1 |
| 22 TEX 6-2 16:1 | | 72 TEX 9-5 74:1 |
| 23 HOU 5-3 16:1 | | 73 HOU 8-2 76:1 |
| 24 HOU 4-1 17:1 | | 74 TEX 8-7 76:1 |
| 25 TEX 6-4 18:1 | | 75 HOU 8-3 77:1 |
| 26 TEX 6-1 18:1 | | 76 HOU 8-4 79:1 |
| 27 HOU 6-5 18:1 | | 77 HOU 8-5 82:1 |
| 28 TEX 4-0 18:1 | | 78 TEX 10-4 85:1 |
| 29 HOU 5-2 19:1 | | 79 TEX 11-2 89:1 |
| 30 HOU 2-0 19:1 | | 80 TEX 9-6 94:1 |
| 31 TEX 6-5 20:1 | | 81 HOU 8-6 94:1 |
| 32 TEX 5-0 22:1 | | 82 HOU 8-1 97:1 |
| 33 TEX 7-2 22:1 | | 83 HOU 7-0 98:1 |
| 34 HOU 3-0 22:1 | | 84 TEX 10-0 99:1 |
| 35 TEX 7-3 23:1 | | 85 TEX 10-5 100:1 |
| 36 TEX 7-1 24:1 | | 86 TEX 11-1 104:1 |
| 37 TEX 7-4 25:1 | | 87 TEX 11-3 106:1 |
| 38 HOU 5-1 26:1 | | 88 TEX 11-4 120:1 |
| 39 HOU 6-4 26:1 | | 89 HOU 9-3 120:1 |
| 40 TEX 6-0 26:1 | | 90 HOU 9-2 124:1 |
| 41 HOU 6-3 27:1 | | 91 TEX 9-7 128:1 |
| 42 TEX 8-2 30:1 | | 92 HOU 9-4 132:1 |
| 43 HOU 6-2 31:1 | | 93 TEX 11-0 135:1 |
| 44 TEX 7-5 31:1 | | 94 TEX 12-2 135:1 |
| 45 HOU 4-0 31:1 | | 95 TEX 10-6 144:1 |
| 46 TEX 8-3 33:1 | | 96 TEX 12-3 145:1 |
| 47 TEX 8-1 33:1 | | 97 HOU 9-8 145:1 |
| 48 HOU 7-6 34:1 | | 98 HOU 8-0 152:1 |
| 49 TEX 7-0 35:1 | | 99 HOU 9-1 156:1 |
| 50 HOU 6-1 37:1 | | 100 TEX 12-1 159:1 |
Monday, March 25, 2013
Dodgers Best Lineup
With Hanley Ramirez starting the season on the DL, the Dodgers will have to make some changes to their starting lineup and with these changes comes the question of what their most productive lineup is. I used my simulator to figure out just that. I used 2013 Bill James projections as input and for this exercise I had the simulator come up with the most productive lineup against RHP. I assumed that the Dodgers would start Nick Punto at 3B against RHP and I am not about to project Puig as a starter yet. Here is the best lineup that it found.
1. Carl Crawford (L)
2. Matt Kemp
3. Adrian Gonzalez (L)
4. Andre Ethier (L)
5. Luiz Cruz
6. Mark Ellis
7. Nick Punto (S)
8. A.J. Ellis
9. Pitchers Spot
I was surprised to see that batting the pitcher 8th was no longer the best option. I suppose having a weak hitter like Nick Punto in the lineup put a damper on that strategy.
Wednesday, February 20, 2013
Exportable 2013 MLB Schedule
Something that is difficult to find on the internet is an excel download file of the 2013 MLB Schedule. I have taken the time to type up the complete 2013 MLB Schedule in to CSV format and uploaded it to google docs. The file is free to download and can be found at the following link.
Here is the format that the file is in
Game ID,Year,Month,Day,Away,Home
1,2013,3,31,TEX,HOU
2,2013,4,1,FLA,WAS
3,2013,4,1,SD,NYN
4,2013,4,1,CHN,PIT
5,2013,4,1,COL,MIL
6,2013,4,1,SF,LAN
7,2013,4,1,PHI,ATL
8,2013,4,1,STL,ARI
9,2013,4,1,DET,MIN
10,2013,4,1,BOS,NYA
.
.
.
2428,2013,9,29,OAK,SEA
2429,2013,9,29,COL,LAN
2430,2013,9,29,WAS,ARI
Tuesday, February 12, 2013
2013 MLB Win Totals - Part I
Instead of just posting the current Vegas MLB odds to win the World Series, I am going to take things a step further and interpolate those W.S. odds out to 2013 win totals. There is no great scientific method that I am going to be using except for keeping consistent with the Vegas odds in the order I assign team wins. I think I have a pretty good idea at what Vegas typically sets their highest and lowest over/under win totals at, so everything in between I can do an "eye ball" interpolation on to set the win total over/under for each team. Later in my Part II of this series, I will use a more scientific method for matching up the Vegas odds to win totals. But for now... here we go!
| Team | Odds To Win W.S. | % Chance to Win | 2013 Wins Over/Under |
| Angels | 8-1 | 8.39 | 93 |
| Dodgers | 8-1 | 8.39 | 93 |
| Blue Jays | 8-1 | 8.39 | 93 |
| Nationals | 8-1 | 8.39 | 93 |
| Tigers | 9-1 | 7.55 | 92 |
| Braves | 12-1 | 5.81 | 90 |
| Yankees | 12.5-1 | 5.59 | 89 |
| Reds | 13-1 | 5.40 | 88 |
| Rangers | 13.5-1 | 5.21 | 88 |
| Phillies | 17-1 | 4.20 | 86 |
| Giants | 17-1 | 4.20 | 86 |
| Red Sox | 20-1 | 3.60 | 85 |
| Cardinals | 20-1 | 3.60 | 85 |
| Rays | 22-1 | 3.28 | 84 |
| Athletics | 30-1 | 2.44 | 82 |
| Orioles | 40-1 | 1.84 | 81 |
| Diamondbacks | 45-1 | 1.64 | 80 |
| White Sox | 50-1 | 1.48 | 79 |
| Royals | 50-1 | 1.48 | 79 |
| Brewers | 50-1 | 1.48 | 79 |
| Pirates | 72-1 | 1.03 | 77 |
| Mets | 75-1 | 0.99 | 75 |
| Padres | 75-1 | 0.99 | 75 |
| Indians | 77.5-1 | 0.96 | 75 |
| Cubs | 100-1 | 0.75 | 71 |
| Rockies | 100-1 | 0.75 | 71 |
| Mariners | 110-1 | 0.68 | 70 |
| Twins | 125-1 | 0.60 | 67 |
| Marlins | 150-1 | 0.50 | 63 |
| Astros | 200-1 | 0.38 | 61 |
Notes:
Percent chance of winning W.S. has the Vegas juice removed.
American League has a 51.5% (Vegas) chance of winning the W.S.
National League has a 48.5% (Vegas) chance of winning the W.S.
Odds were taken from 5Dimes on 2/12/13.
In calculating the pecent chance to win the W.S., I removed the Vegas "juice".
The 2013 Over/Unders from the Atlantis came out the day after this post.
For the most part, I did a straight interpolation from (Vegas) World Series odds to an over/under on team wins. There a couple of things that could be wrong with this. The first comes from the possibility that the Vegas World Series odds have some bias to them. Perhaps Vegas moved the odds up or down based on how popular a team is. This of course has nothing to do with my methodology. On the otherhand, something that does have to do with my methodology is that I am not controlling for the teams playing in divisions. Divisions that may be stronger or weaker than others. For example, the Royals might win a World Series out of every 50 times playing out of the AL Central, but what if they played out of the AL East? Chances are that 50 number would climb. A next step to this exercise would be to control for how hard or easy it is to win a division. I'm not sure on the best way to do this yet, so if you have any ideas feel free to leave a comment or send me a tweet (@DodgerSims).
Wednesday, January 30, 2013
2013 World Series Odds
As of 1/30/2013...
| Team | 12/15/12 Odds | 12/29/12 Odds | 1/30/13 |
|---|---|---|---|
| Angels | 7-1 | 7-1 | 7-1 |
| Tigers | 7-1 | 7-1 | 7-1 |
| Dodgers | 7-1 | 7-1 | 7-1 |
| Nationals | 8-1 | 8-1 | 8-1 |
| Blue Jays | 10-1 | 10-1 | 10-1 |
| Yankees | 10-1 | 12-1 | 14-1 |
| Reds | 10-1 | 12-1 | 12-1 |
| Rangers | 10-1 | 14-1 | 18-1 |
| Cardinals | 14-1 | 14-1 | 14-1 |
| Giants | 14-1 | 14-1 | 14-1 |
| Phillies | 16-1 | 14-1 | 14-1 |
| Braves | 16-1 | 16-1 | 14-1 |
| Rays | 20-1 | 16-1 | 16-1 |
| Brewers | 30-1 | 30-1 | 60-1 |
| Red Sox | 30-1 | 30-1 | 30-1 |
| Athletics | 40-1 | 30-1 | 30-1 |
| Royals | 30-1 | 40-1 | 40-1 |
| White Sox | 40-1 | 40-1 | 40-1 |
| Diamdonbacks | 40-1 | 50-1 | 50-1 |
| Orioles | 50-1 | 50-1 | 50-1 |
| Pirates | 50-1 | 50-1 | 50-1 |
| Cubs | 60-1 | 50-1 | 50-1 |
| Mariners | 100-1 | 80-1 | 80-1 |
| Indians | 100-1 | 80-1 | 80-1 |
| Mets | 60-1 | 100-1 | 100-1 |
| Padres | 100-1 | 100-1 | 100-1 |
| Marlins | 100-1 | 100-1 | 100-1 |
| Twins | 100-1 | 100-1 | 100-1 |
| Astros | 100-1 | 100-1 | 100-1 |
| Rockies | 100-1 | 100-1 | 100-1 |
Source: Sportsbook.com
Friday, January 04, 2013
The Better Offense - Rockies or Dodgers
So there is this Buster Olney guy who gets paid money to write about baseball. Recently, he put up an article where he ranked the best offenses in baseball. More than a few Dodgers fans were up in arms when Buster ranked the Rockies offense a few spots ahead of the Dodgers offense. I was asked by a couple followers on twitter to run the numbers through my simulator where I can take into effect things like the enormously friendly park that the Rockies hit in.
This is a pretty easy exercise for me to run in my simulator. What I did is get park neutral offensive stats for both the Rockies and Dodgers lineups. I took the 8 starting hitters for each teams, as listed at MLBdepthCharts website and gave each team what the simulator thought was its most efficient lineup. I then gave each team the exact same starting pitcher, bullpen, bench and made all park factors league average. I then ran five million individual game simulations, pitting the two teams together. I let each team be the away/home team and repeated the above process for both a right handed and left handed starting pitcher.
So the only difference is the two hitting lineups, everything else is held constant. The metric to determine the better offense can now be measured in how many of the five million games each team won. Here are the results...
Subscribe to:
Posts (Atom)